How to read this diagram?
Example diagram:
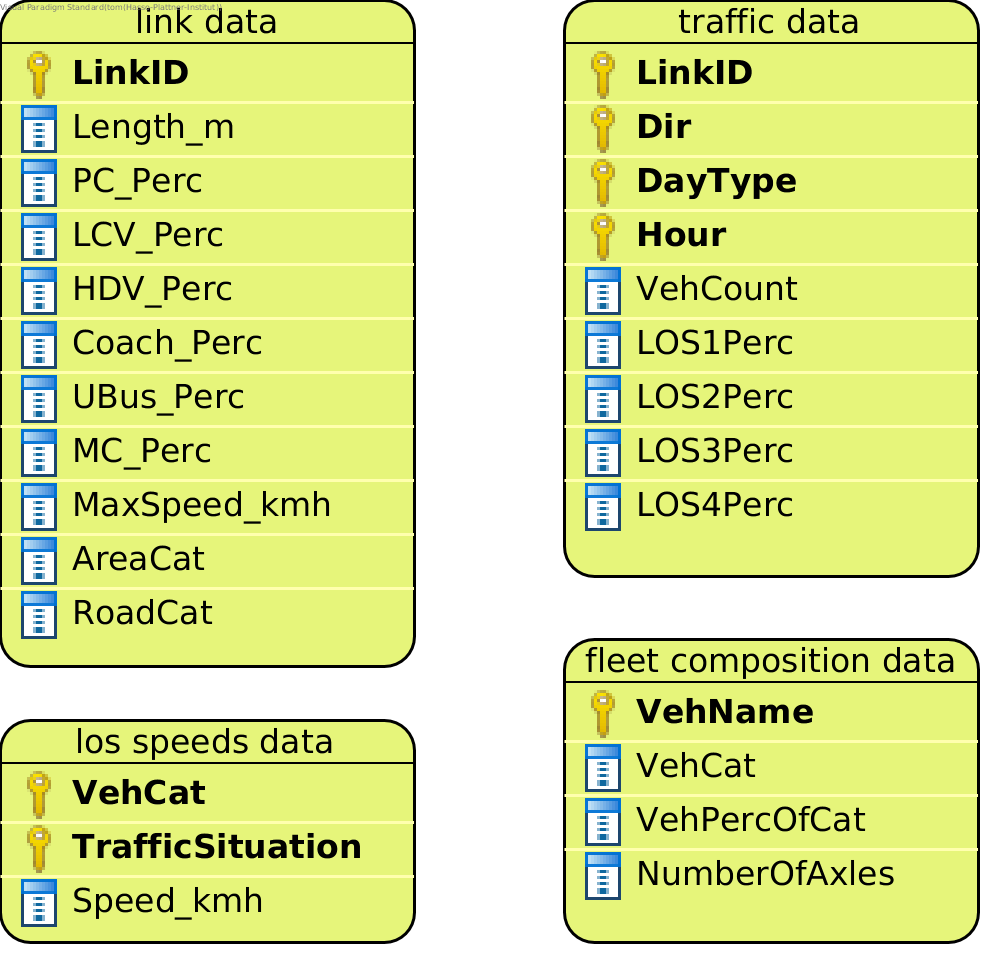
Each of the yellow boxes represents one csv file containing a dataset. The example diagram above describes four files: link data, traffic data, los speeds data, and fleet composition data.
The entries in the yellow boxes are the columns of the dataset. So the dataset los speeds data contains the columns VehCat, TrafficSituation, and Speed_kmh.
The yellow key symbols next to some column names indicate that the column is part of the primary key of the dataset. (Note that the linked article mentions relational databases. Don’t get distracted by that, we work with csv files.) Key symbols with a little arrow indicate that the column is a foreign key for a different dataset. If a column does not have a key symbol, it is not part of the primary key of the dataset.
Note that the column names for the datasets are fixed. You should adapt your datasets to fit the column names shown in the diagram.